


How to do scenario modeling
De-risk any initiative by figuring out what needs to happen to meet your goals

👋 Hi, it’s Torsten. Every week or two, I share actionable advice to help you grow your career and business, based on operating experience at companies like Uber, Meta and Rippling.
If you enjoyed the post, consider sharing it with a friend or colleague 📩; it would mean a lot to me. If you didn’t like it, feel free to send me hate mail.
When I told my professors at MIT that I was joining Uber, they all told me that I was making a big mistake.
“That business will never make money”, they said.
What they meant, however, was “Uber is losing a lot of money right now, and it doesn’t seem to be getting better, so it’s probably a bad business model.”
So why did I have confidence in my decision when all these smart people were telling me I was jumping on a sinking ship?
Because I’d interned at Uber over the summer and had seen 1) how the business was operating at the time, and 2) all the things it could improve — over time and at larger scale — to eventually turn profitable.
Based on these insights, I’d created a simple scenario model that had shown me the potential of the business and what needed to happen to get to profitability. As long as I believed that those things were realistic, I’d be fine.
And it turns out, Uber did start making money:
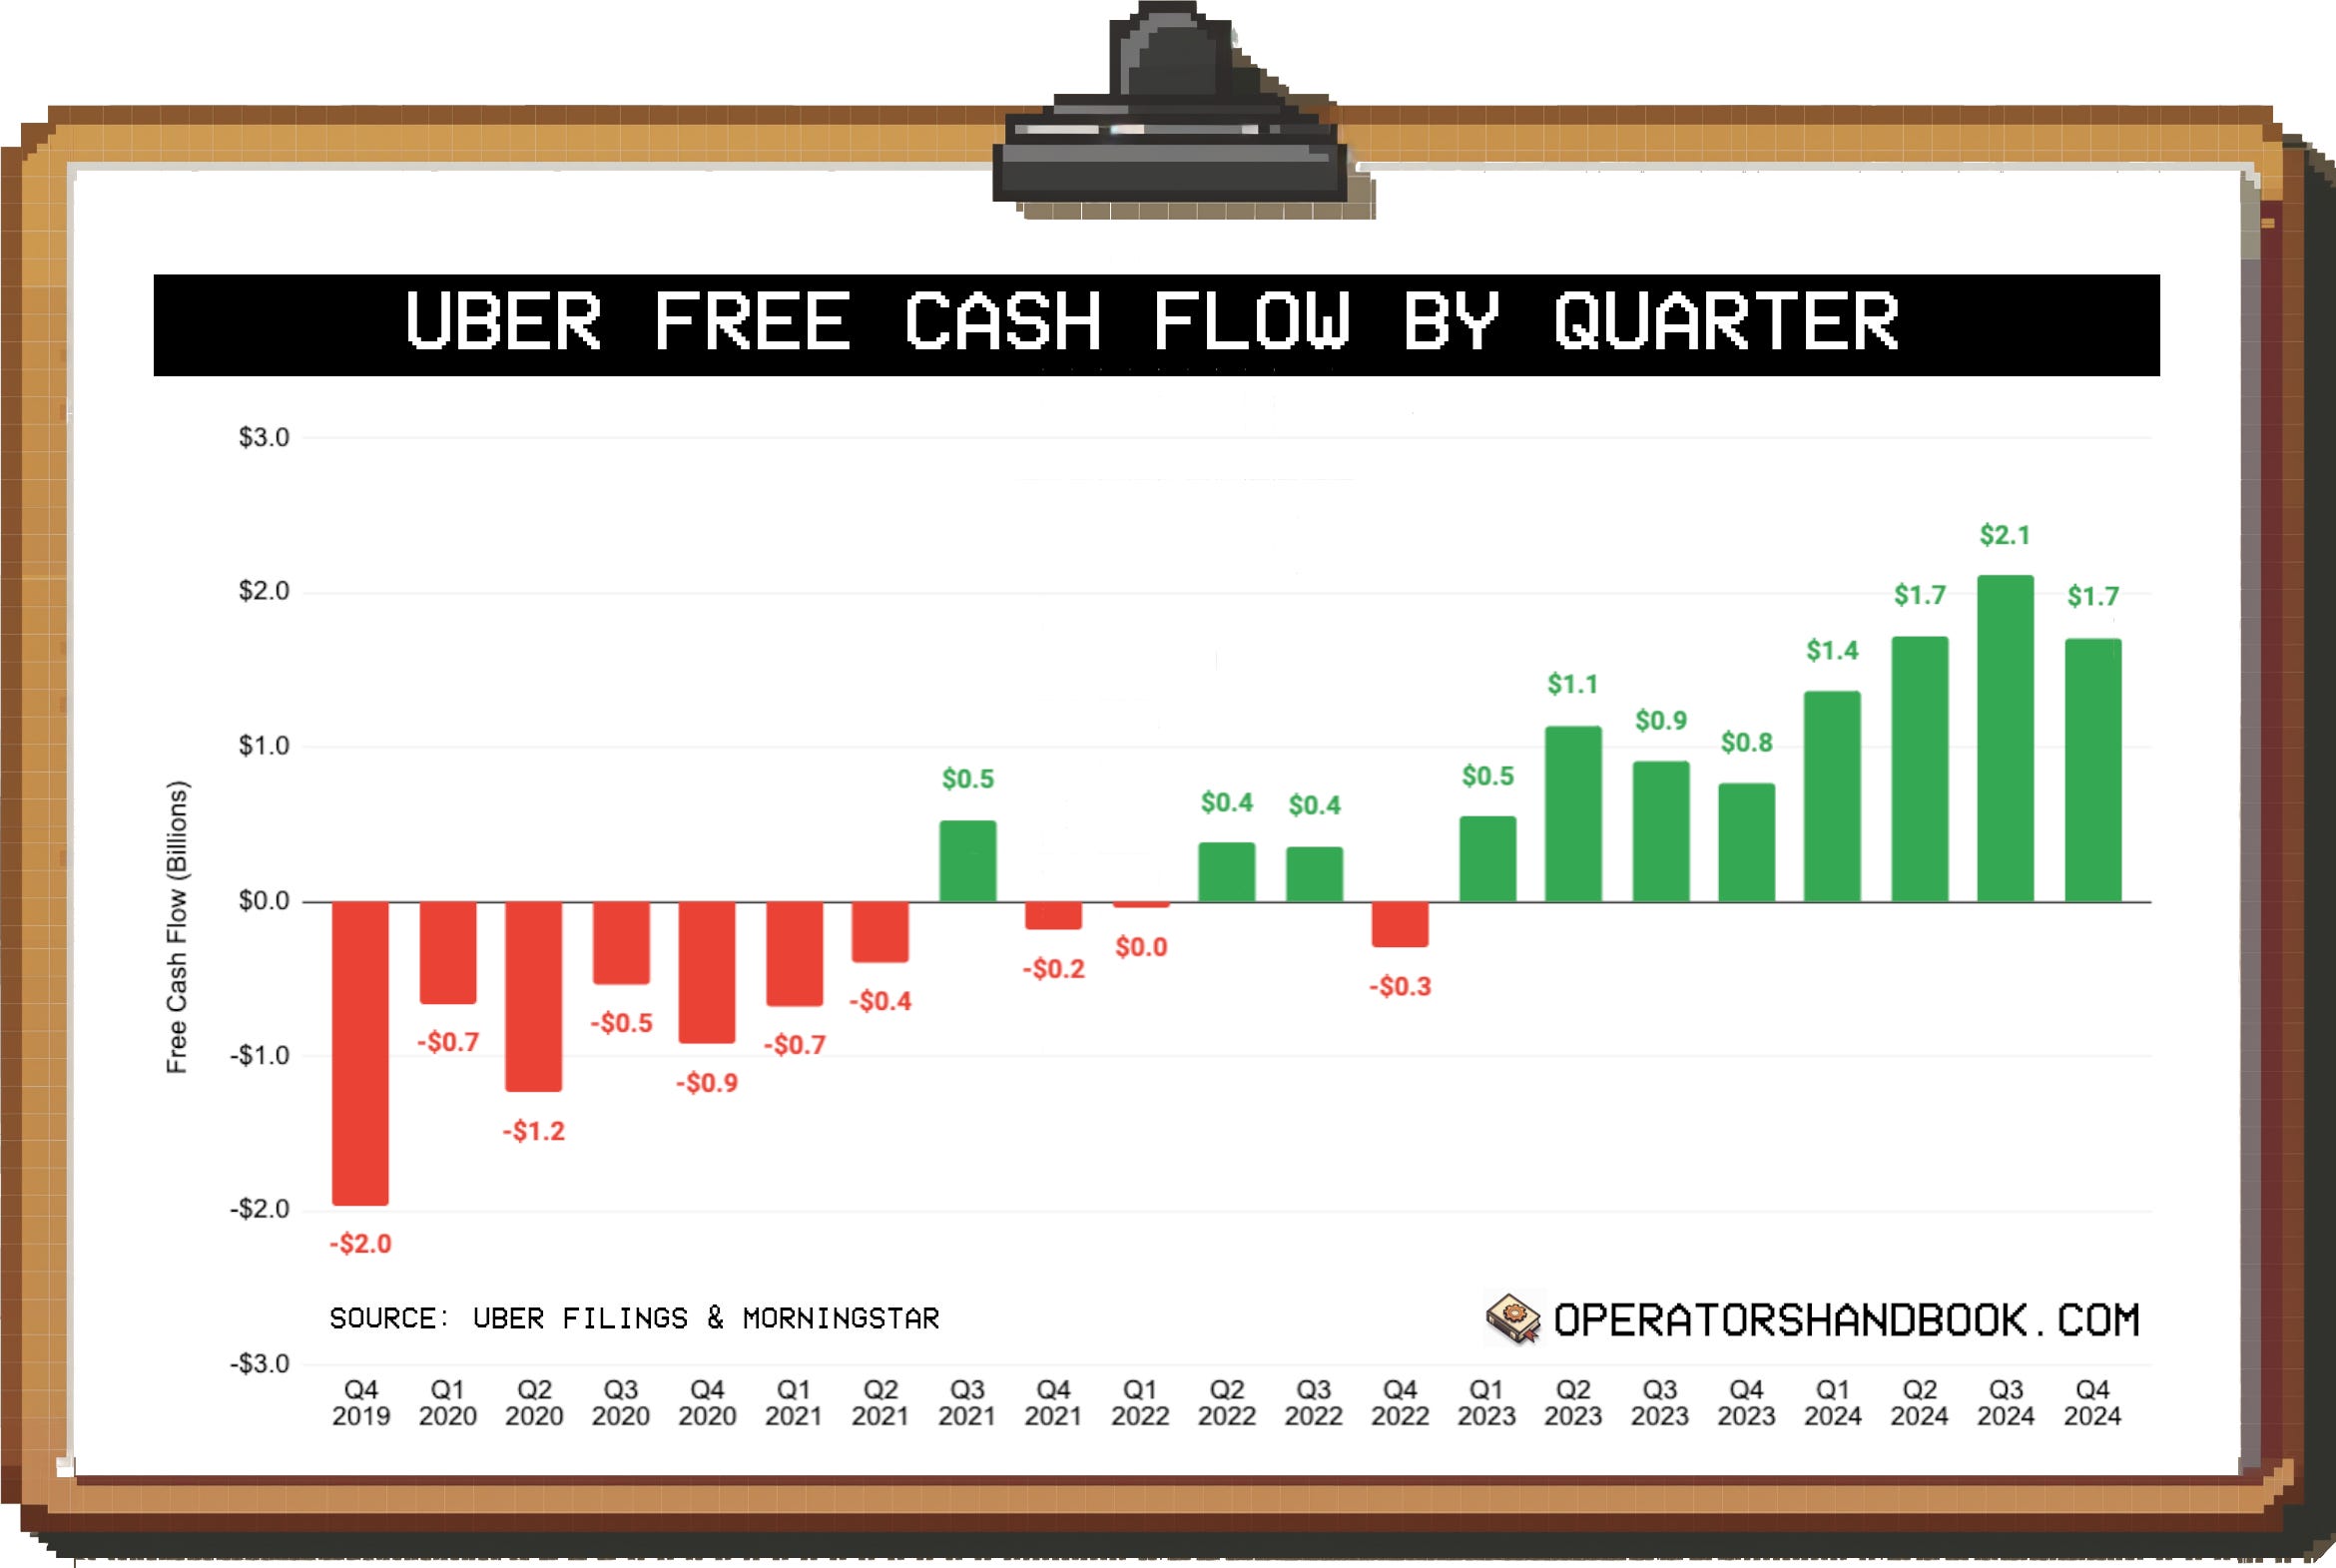
Scenario modeling is a powerful tool, and once you get the hang of it, it’s not particularly difficult to do.
In this post, we’ll dig deeper into 1) what scenario modeling is, 2) why it’s useful, and 3) how to do it.
After that brief primer, the majority of the post will be focused on an in-depth real-world example to show you what it looks like in practice.
Let’s dive in.
Part 1: What is scenario modeling, and what is it good for?
In the example in the intro, running a scenario analysis helped me decide whether to accept a job offer or not. But you’ll be able to use it on the job, too — once you know how to do it, it comes in handy all the time.
But what exactly makes scenario analyses worth the effort?
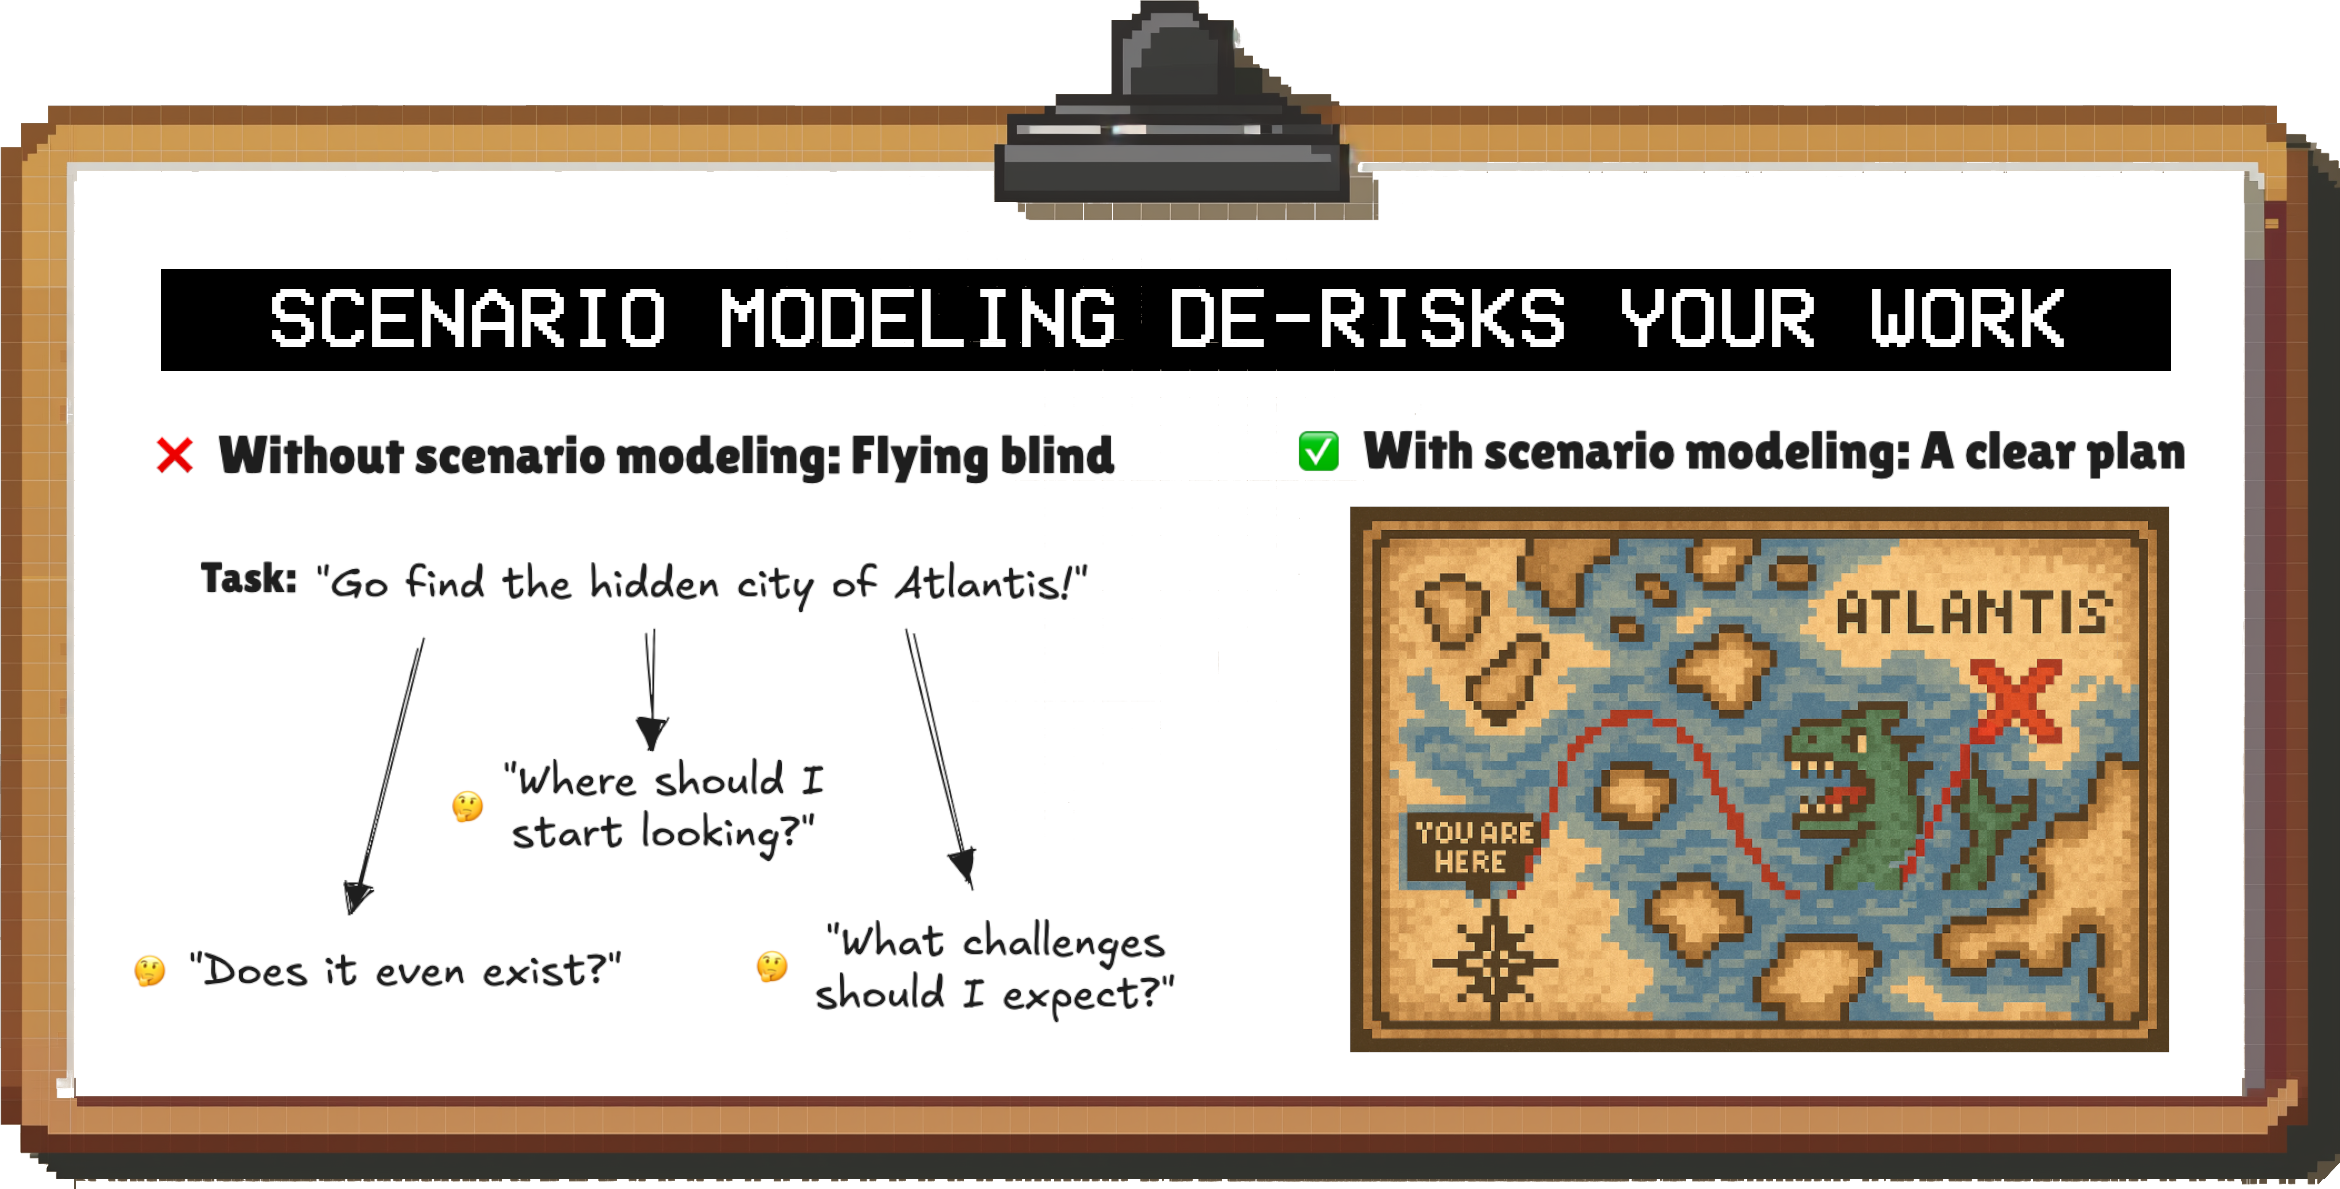
The simple reason is that execution is hard, and it’s often costly to reverse bad decisions.
Even if you know something is possible and what you need to do, it’s going to be difficult to actually do it. But if you don’t even know that, you’re adding a massive additional risk — you might be wasting your time entirely or focusing on the wrong things.
A scenario analysis helps by:
Telling you whether it’s even possible to get where you want to go
What the key drivers are that you need to be on top of
What numbers you need to hit for things to work out (so you can track progress along the way)
For example, when I was at Meta, a common question for every new initiative was:
“What would it take to make this a $1B business?”
If we didn’t have confidence that it could eventually reach that level, we would focus our limited time and resources on bets with higher potential.
Similarly, when I worked in B2B SaaS, we were wondering: “What has to be true for us to profitably scale an Outbound motion?”
Figuring this out in advance allowed us to structure our approach in a way that would maximize the odds of success (what customers to target, how many people to hire etc.) and focus on the most important things we needed to get right.
In all of the examples above, we’re trying to figure out how to make something work. To do that, we’re working backwards from a goal (e.g. profitability). However, there is a different — forward-looking — kind of scenario analysis as well: Starting from today, you can project different scenarios for the future.
By using different sets of assumptions (e.g. aggressive vs. conservative), you can get an idea of where you might be headed. This allows you to prepare in advance; for example, you can calculate out how many people you need to hire at a minimum to keep up with future growth.
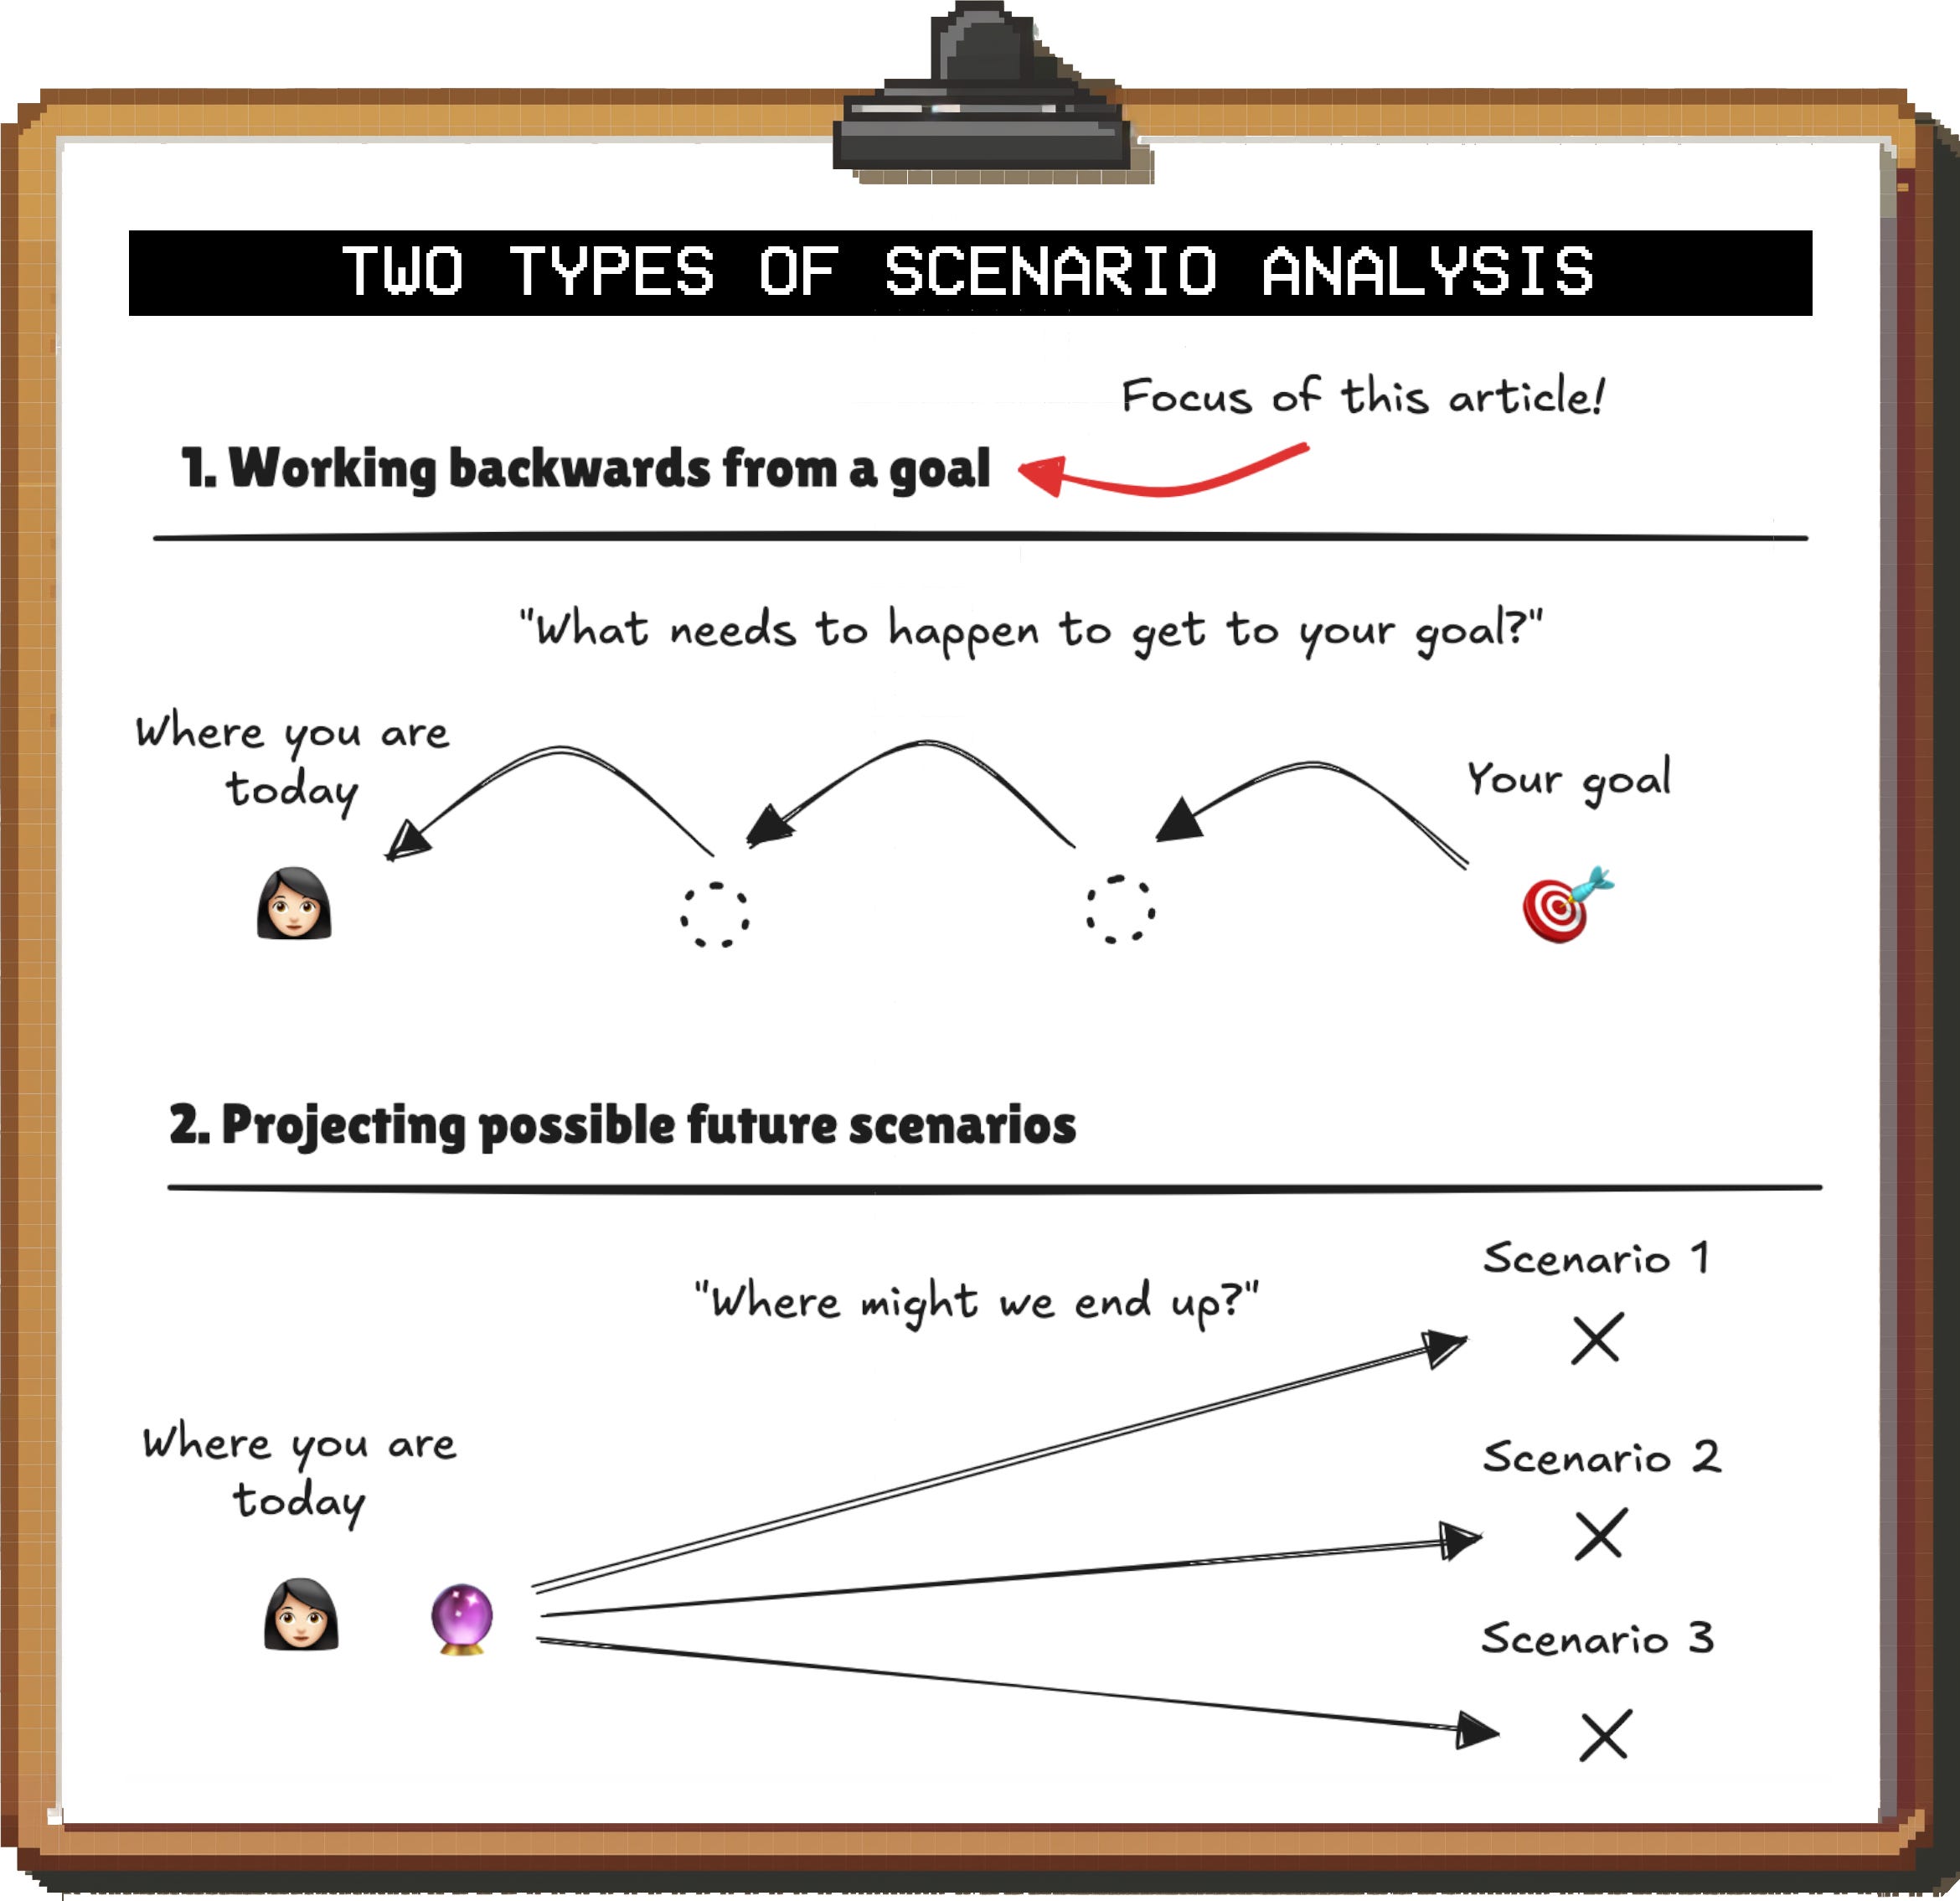
This article will focus on the first kind of scenario analysis (working backwards from a goal); I have covered some basic principles of the forward-looking approach in my post “How to estimate”, but might go deeper on this in the future.
Part 2: How to do scenario modeling
The high-level sequence of steps for this type of analysis is as follows:
Step 1: Define the goal
Step 2: Lay out the driver tree
Step 3: Assign baseline values to each driver
Step 4: Quantify the gap
Step 5: Identify key drivers & sensitivities
Step 6: Find scenarios that allow you to hit your goal
We’ll go through each step in more detail below.
If you want to jump into hands-on examples immediately, you can skip directly to the next section (Part 3) and come back here as needed.
Step 1: Define the goal metric
The first step is to define the goal you’re trying to hit.
Your goal needs to be clearly defined and quantifiable. For example, it’s not enough to say “I want to make this market launch successful”.
What does “successful” mean in this case, and how do you break this down into metrics?
A better definition of your goal in this case would be something like “I want to grow this new market to $10M in ARR”. That way, you have a (somewhat) clearly defined metric and a number you need to hit.1
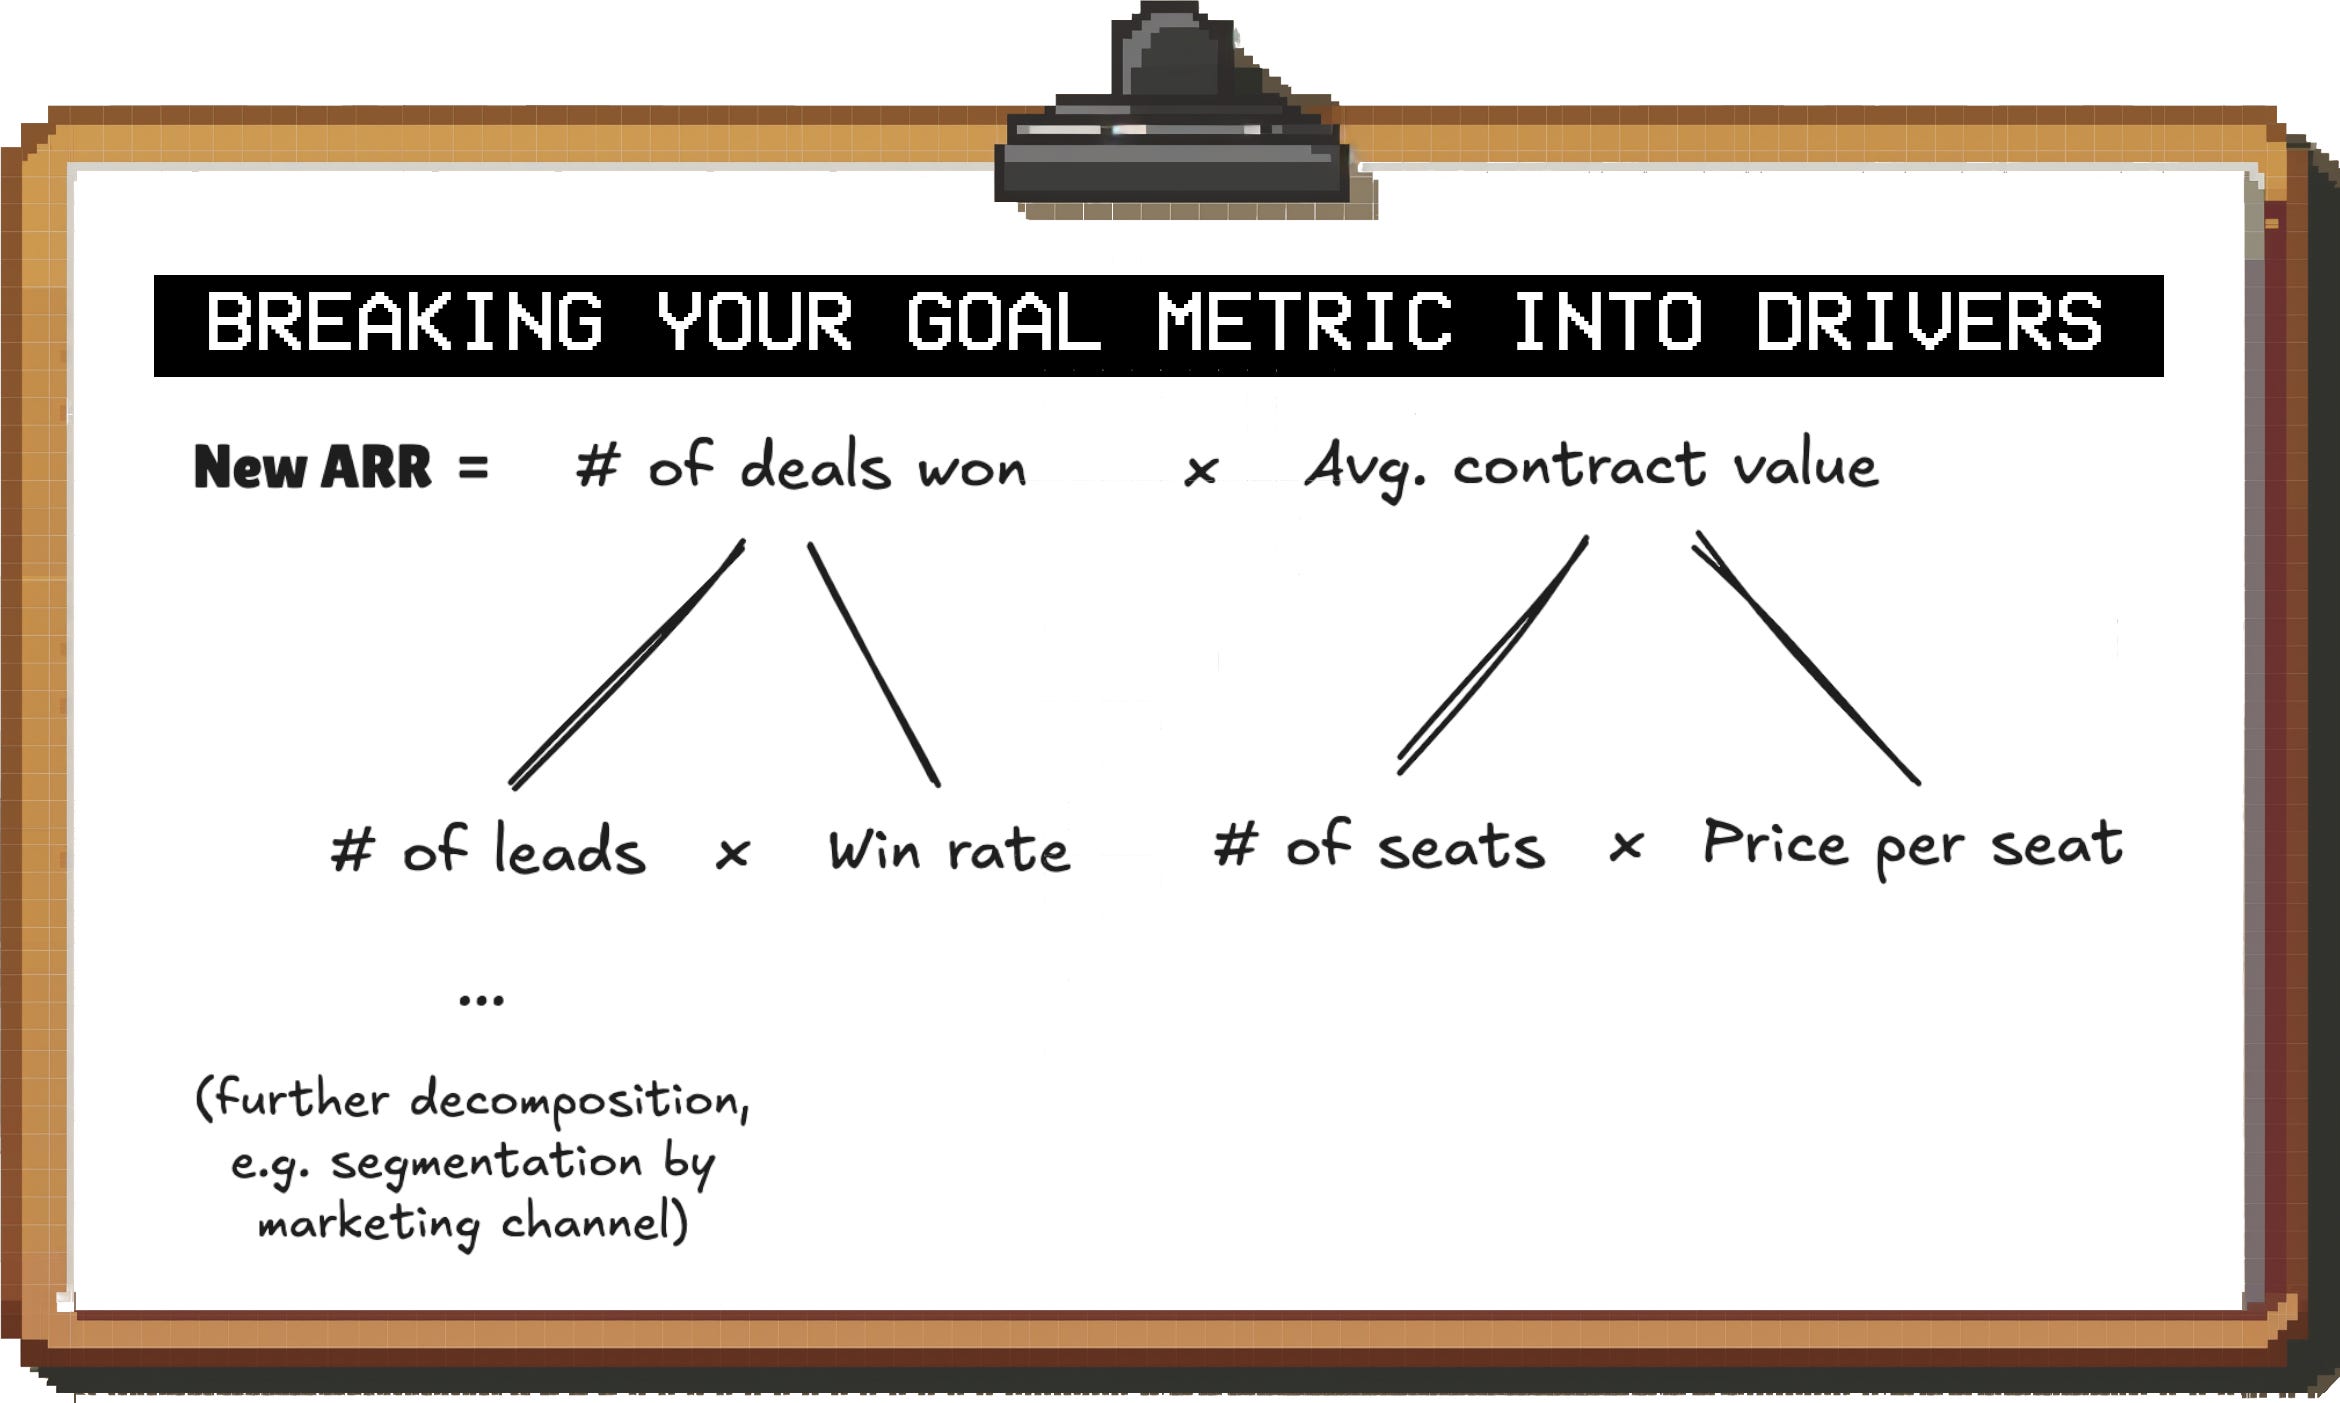
Step 2: Lay out the driver tree
Once you have your goal metric, you need to decompose it into its key drivers. This will form the basis for your analysis.
I won’t lay out a full driver tree here since we’re getting into a detailed example below, but even the first few levels give us a pretty good idea of the levers we can pull:
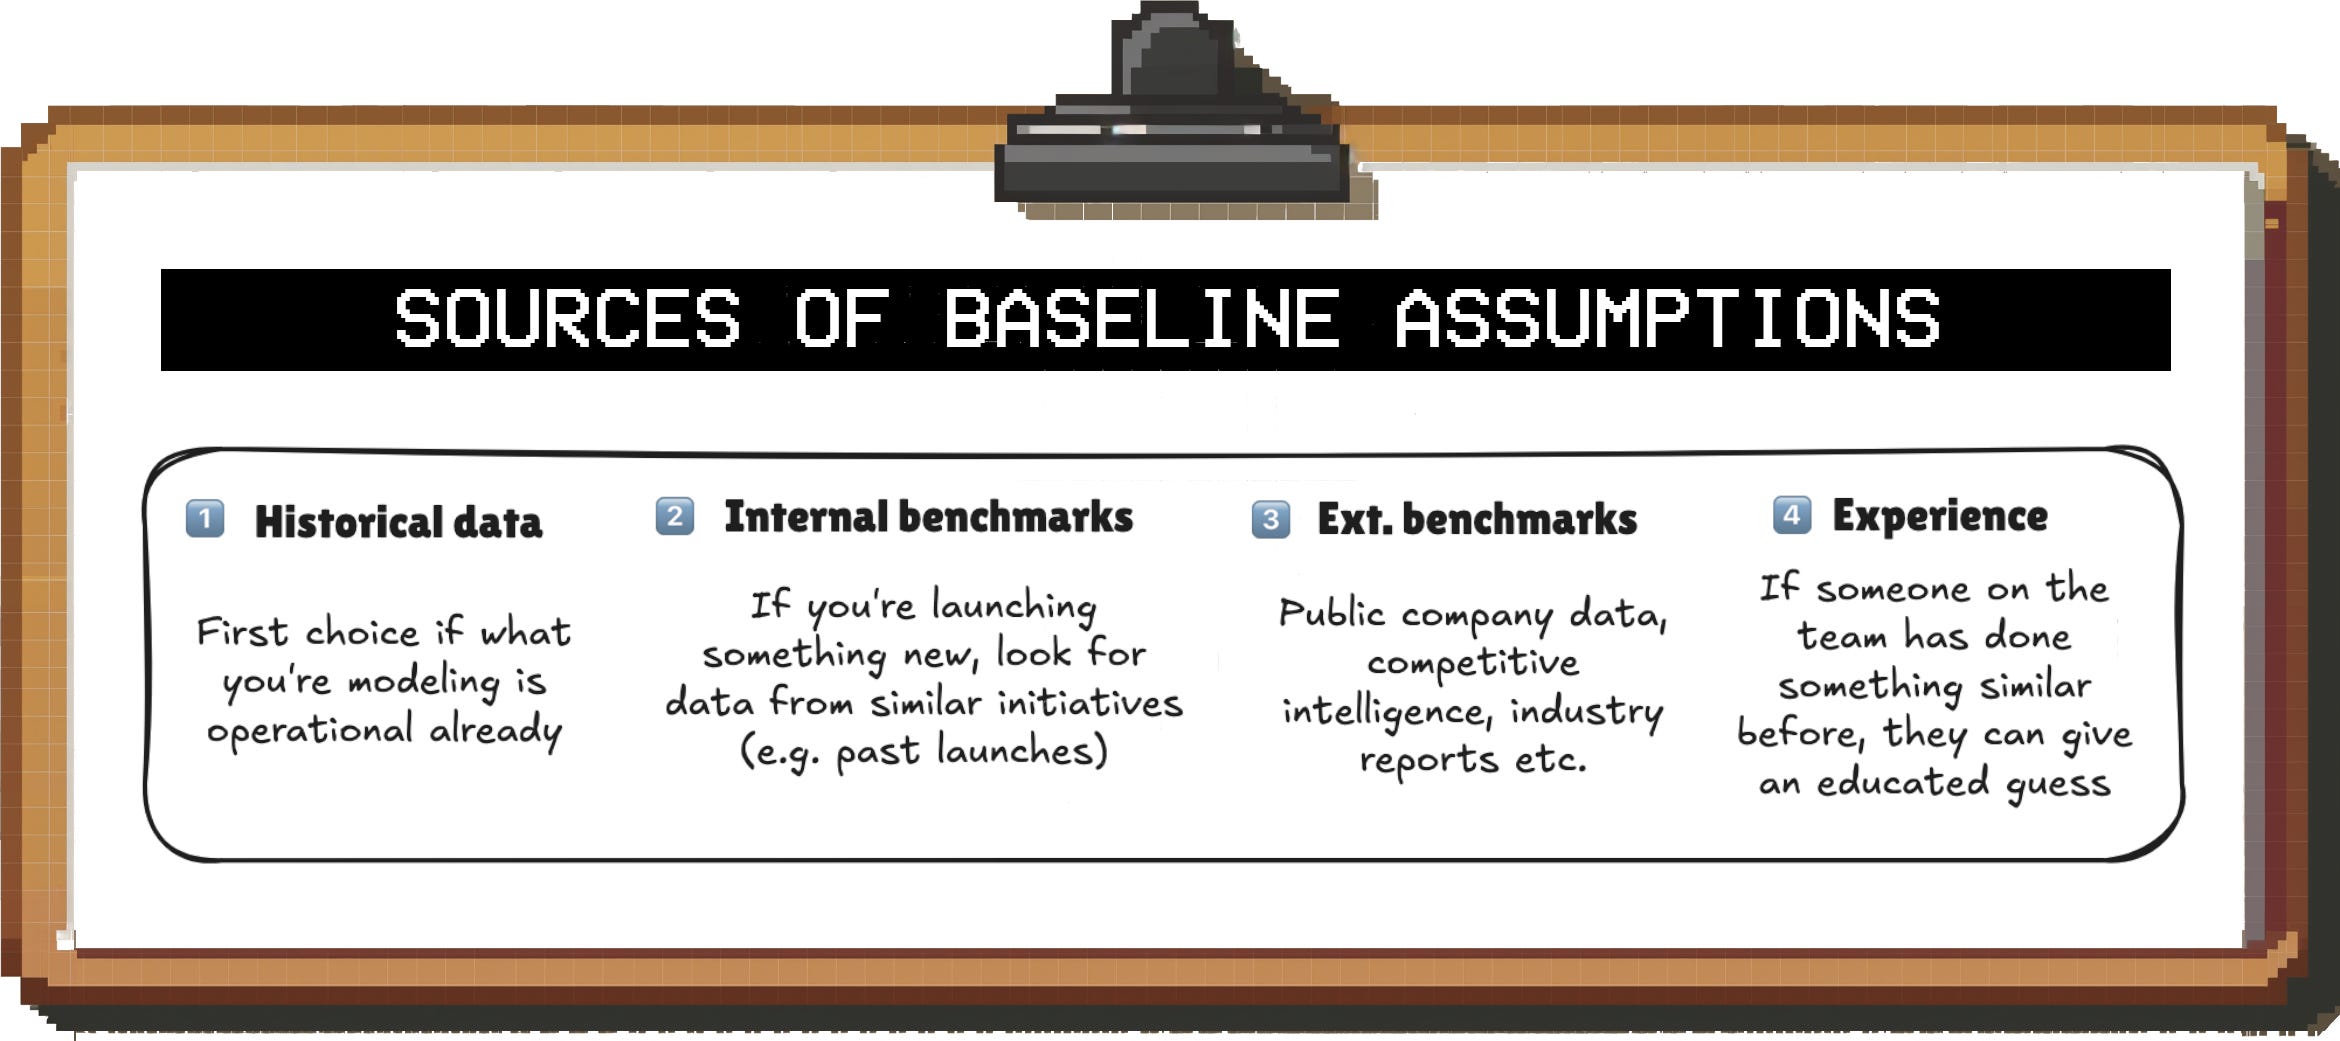
Step 3: Assign baseline values to drivers
To limit complexity, you won’t want to play with a range of assumptions for every single driver. But you also can’t completely leave them out of the analysis; otherwise, your result won’t be accurate.
As a result, you need to assign baseline values to each driver; then, in the next steps, you’ll model out assumptions for a select few.
The baseline values can come from a number of sources:
Step 4: Quantify the gap
Now, since you assigned starting values to all drivers, you can calculate how close (or far away) you are from your goal.
This delta can help you decide which drivers are worth focusing on. For example, if you see that you need to improve your target metric by 3x, there’s no point looking into drivers that can only realistically improve by a few percentage points.
Step 5: Identify key drivers & sensitivities
Based on your understanding of how much of a gap you have to bridge, you should now identify your most promising drivers.
The key considerations are:
1️⃣ Which drivers are directly correlated with your goal?
Generally, you’ll want to focus most of your effort on global drivers, i.e. those that affect the entire business instead of just a subsegment (e.g. a specific market or marketing channel)
2️⃣ Which drivers have the biggest headroom?
As mentioned above, the more of a gap you have to your goal, the more you need to focus on the drivers with the biggest room for improvement
3️⃣ Which drivers are under our direct control?
The less directly you control the driver, the higher the risk that your assumptions won’t come true in the real world
For example, if your scenario model relies on organic website traffic growth, you are at the mercy of the Google algorithm if you want to hit your goal
4️⃣ Which drivers can you move with the least cost?
Moving some drivers has negative consequences for the business, either immediately or in the future
The lower the cost (or negative consequences) of moving a driver, the more likely you are to get buy-in for your plan
Step 6: Find scenarios that allow you to hit your goal
As long as your goal isn’t impossible to achieve, there will be an infinite number of different paths to reaching it.
In my experience, picking scenarios that represent a “random” combination of assumptions (a little bit of an improvement here, a small change in performance there) isn’t very helpful as it doesn’t give you a clear strategic direction.
Instead, try to tease out one or two distinct scenarios that make it clear where the priorities should lie. For example, you might find that there is a driver that is 1) directly under your control and 2) has a lot of headroom, and improving this one driver alone could get you to your goal.
That is a clear message that can help you get the team aligned on the path forward. We’ll get into examples of what that looks like in practice below.
Lastly, at this stage of the exercise, you might notice that the target seems impossible to hit. If that’s the case, there are two options:
Option 1: You have a very wrong assumption somewhere
To rule this out, ask other people to sanity check your work — when you’re heads-down modeling, it’s easy to miss the forest for the trees
For example, your numbers might be too low because you only looked at the US market and forgot about the potential of international expansion.
Option 2: The target is actually impossible to hit
While this might not be the result you were hoping for, it’s still valuable. Instead of spending months trying to make the initiative work, you now have a quantitative argument for why you shouldn’t invest resources in it
Part 3: Hands-on scenario modeling example
Before we get into it, I want to make something clear: Scenario modeling is a flexible tool you can add to your toolkit and it can be applied to a wide range of problems.
Your work doesn’t have to be at all similar to what I’m describing here for it to be relevant to you. The purpose of this example is simply to illustrate how to apply the technique in practice.
Example: Running a profitable food delivery marketplace
Scenario
Let’s say you’re working a food delivery company like DoorDash, UberEats, etc. The company is currently losing money on each transaction, but obviously, the goal is to eventually turn profitable.
For simplicity’s sake, let’s define “profitable” as generating a positive contribution margin with your average order, defined like this:

Let’s take a closer look at each bucket.
Revenue (the stuff you make money from):
Fees you charge the end user (mainly a % fee applied to the basket size)
Fees you charge the restaurant (typically a % fee applied to the basket size if there is a contract with the restaurant)
Cost (the stuff you have to pay for):2
Courier pay
Cost of unfulfilled orders
With that, we have our goal metric (“profitable contribution margin per order”) and a simple driver tree (steps #1 and #2 from the framework above).
Quantifying the status quo
With our drivers laid out, let’s assign a baseline value to each to understand where we’re at compared to our goal.
In this example, since we’re already operating a live delivery marketplace, we’d be able to pull this data from our internal data warehouse.
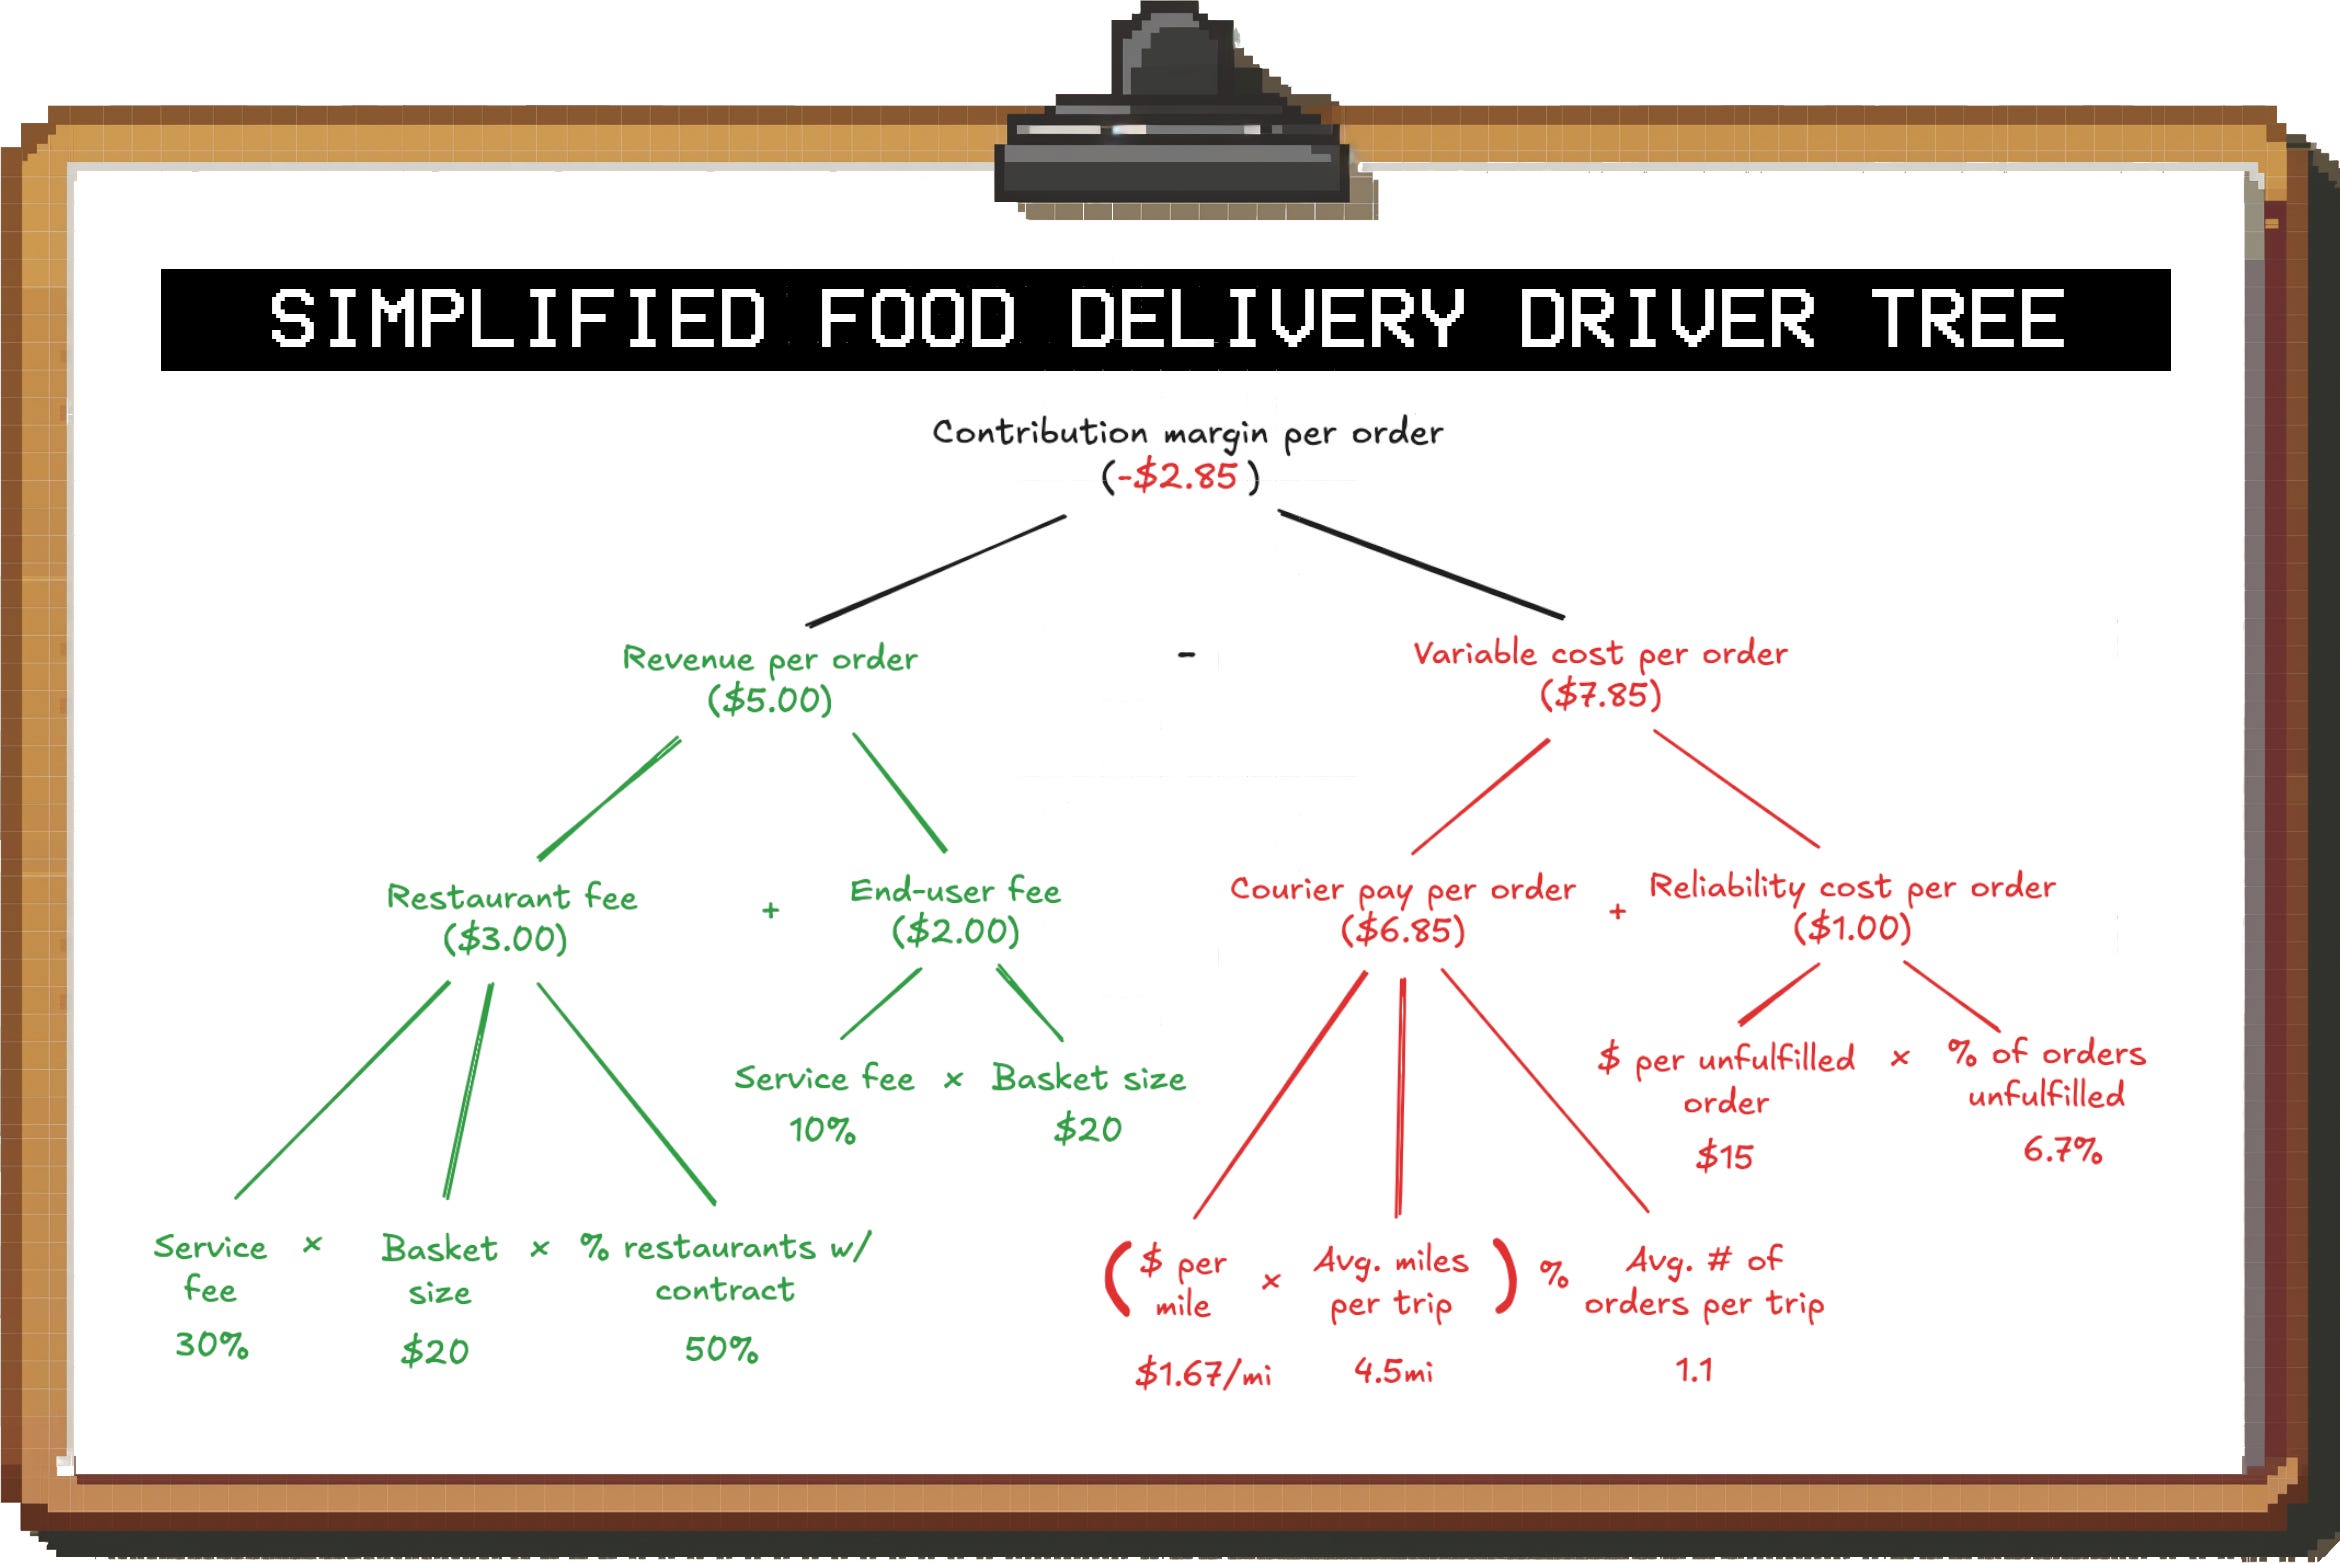
What should jump out at you: We are currently losing $2.85 on every order. Keep in mind, that’s before we even try to cover any of the fixed costs of the business.
It’s easy to see that something fundamental has to change.
For reference, what we just did corresponds to steps #3 and #4 from our framework above.
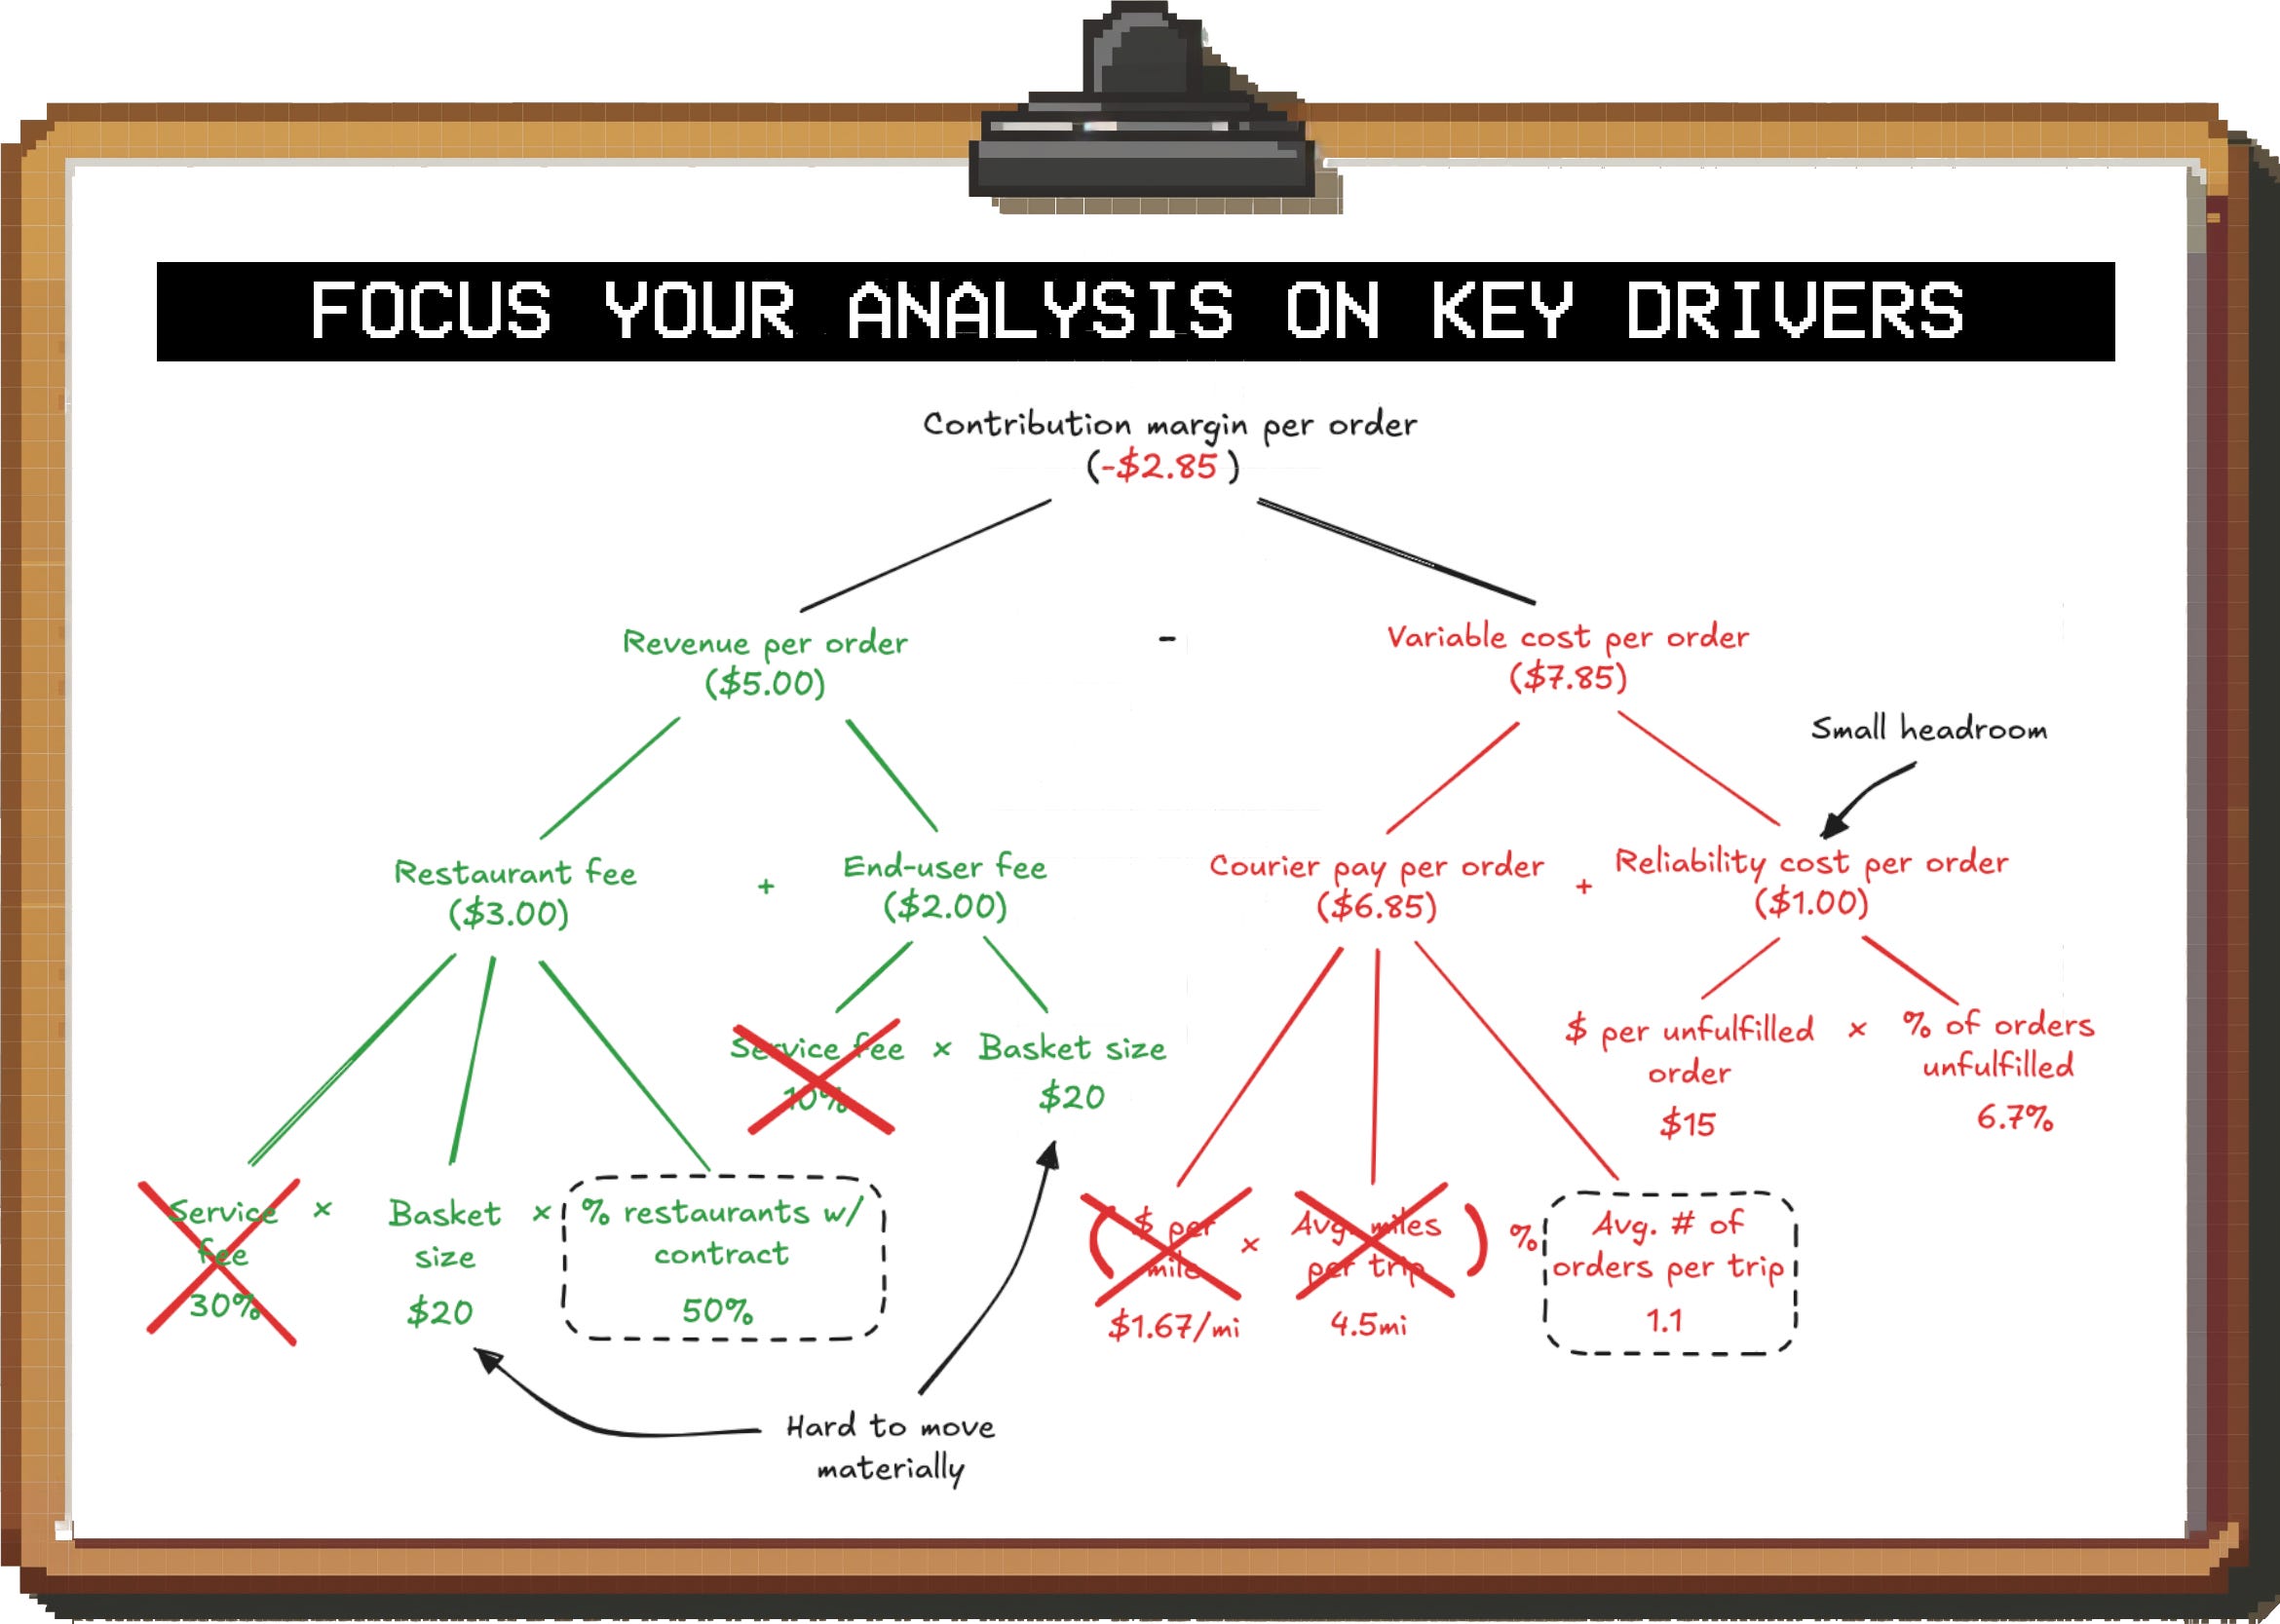
Figuring out how to hit the goal
Now, let’s look at the levers we have and see which ones have the potential to get us to our goal.
At a high level, we could either increase the amount of money we make from each order, or reduce cost.
However, we can rule out a few options pretty quickly based on the priorities of the business:
End-user fees: We don’t want to raise the % fees we charge end users as it will hurt demand
Restaurant fees: Selection is a key part of our strategy, so we don’t want to renegotiate with existing restaurants or increase fees for new ones
However, that doesn’t mean we don’t have options on the revenue side:
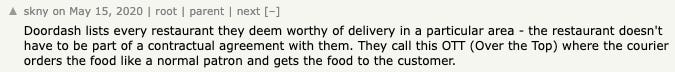
Over-the-top (OTT) orders
Above, we called out that we are only getting money from restaurants that we have a contract with. In our example, that percentage is 50%.
The other restaurants are those we added to the platform without an explicit agreement (called “Over-the-top” or “OTT”); this helps us offer better selection to users, but hurts our unit economics.
We could either 1) stop doing OTT orders or 2) try to convince these restaurants to enter contracts with us based on the order volume we provided to them. Given that we want to maintain strong selection, our priority should be option #2, but this would take longer to show an impact.
Potential impact: Up to $3.00 (in other words, stopping OTT orders completely would turn the contribution margin positive)
Basket size
We could also do various things to increase average basket sizes, which would result in more revenue per order even if we keep restaurant and user fee percentages the same.
For example, we could offer promotions and discounts that incentivize users to order more, and/or we could add up-sell steps to the check-out process.
Potential impact: Every $1 increase in basket size would increase our contribution margin by $0.25; i.e., we’d need a $11.40 (+57%) increase in basket size to get to a neutral contribution margin.
That seems like a stretch without materially changing our restaurant selection or user base, so we should look at cost next.
Reliability cost
If we can’t find a courier to deliver an order, we have to refund the end user. In addition, in cases where we have a contract with the restaurant, we have to pay them for the food that was prepared and not picked up (and won’t charge a fee).3
This is costly, but it only happens occasionally. While we should continuously work on improving reliability, the savings are limited to $1 per order (if we brought the rate of unfulfilled orders to 0).
Given that we need to improve our contribution margin by $2.85, let’s focus on higher-impact levers.
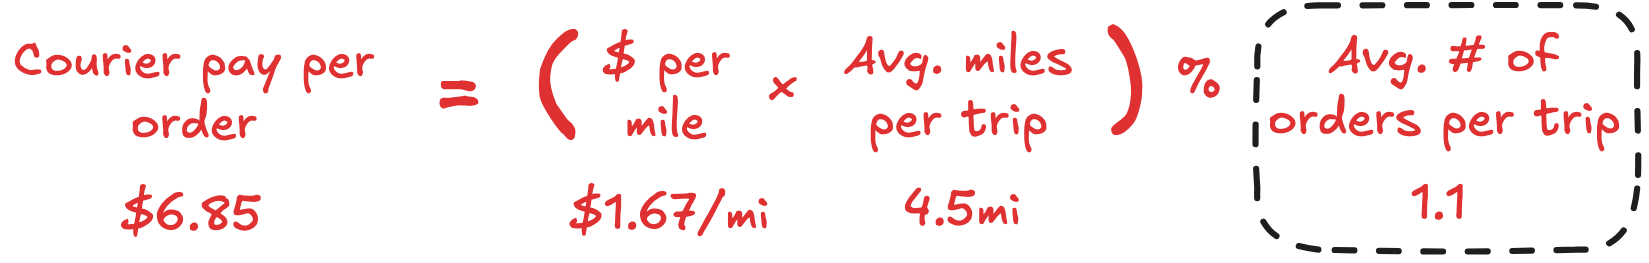
Courier pay
Courier pay rates are set dynamically by the system based on supply and demand.
Since the pay structure in this example is based on distance, we could try to reduce the average trip distance to save money. However, the main way to do this would be to shorten the delivery radius for restaurants and since this would hurt demand, it should be a last resort.
So are we out of options on the cost side? Not exactly.
While we can’t reduce the cost of a delivery trip by much, we can increase the throughput of these trips.
But what does that mean exactly?
Most of the time, our couriers are picking up and delivering single orders. Sometimes, they pick up two or three at the same time if 1) the orders are from the same or close-by restaurants and 2) the users who ordered live in the same direction.
This is called “batching” orders.
If we assume that the pay for the courier remains roughly the same whether they deliver one or multiple orders on a trip (as long as the distance doesn’t change materially), we can reduce the effective cost per order by increasing the batch rate.
The key trade-off that we have to watch out for is that if we batch too aggressively, users will have to wait longer for their orders which might lead to reduced engagement or churn.
Potential impact: Right now, we deliver 1.1 orders per delivery trip on average. If we increased this to 1.5, we’d save ~$1.85 per order.
At 1.9 orders per trip, we’d break even without changing anything else.
Summary
Now, where does that leave us?
Before we did the scenario modeling exercise, we only knew that we were losing $2.85 per order. However, we didn’t know if, and how, we could solve that issue.
Now, we have two clear paths to breaking even and eventually turning a profit:
Over-the-top (OTT) orders: We could either stop doing OTT orders or make a concerted effort to enter contractual agreements with these restaurants so we can charge a fee
Batching: We should invest in 1) increasing demand density in key areas and during key times (to have more orders eligible for batching) and 2) improve our batching algorithm; this will reduce costs per orders without affecting demand
With these insights, we now have concrete initiatives we can rally cross-functional teams behind instead of trying to tweak everything we’re doing a little bit and hoping that it will be enough to make the business work.
TL;DR
Many people blindly jump into execution without fully understanding the problem they’re trying to solve.
While it’s important to move fast, this approach is almost guaranteed to fail. To maximize your chances of success, you should know what you’re trying to achieve and have at least a rough idea of 1) whether it’s theoretically possible and 2) how you can make it happen.
Decomposing your goal into a driver tree and doing a simple scenario analysis might cost you a few hours, but it can save you weeks of wasted effort. Or, conversely, it can prevent you from missing out on opportunities just because they look impossible at first glance.
That’s time well spent, if you ask me.
💼 Featured jobs
Ready for your next adventure? Here are some of my favorite open roles, brought to you by BizOps.careers (sorted from early to late stage):
Traba: Strategy & Operations - General Manager (Special Projects) | 🏠︎ 𝗟𝗼𝗰𝗮𝘁𝗶𝗼𝗻: NY | 💰 𝗦𝗮𝗹𝗮𝗿𝘆: $135k - $150k | 💼 𝗘𝘅𝗽𝗲𝗿𝗶𝗲𝗻𝗰𝗲: 5+ YOE | 🚀 𝗦𝘁𝗮𝗴𝗲: Series A | 🏛️ 𝗜𝗻𝘃𝗲𝘀𝘁𝗼𝗿𝘀: Founders Fund, General Catalyst, Khosla Ventures
Talkiatry: Senior Manager, Business Operations | 🏠︎ 𝗟𝗼𝗰𝗮𝘁𝗶𝗼𝗻: Remote | 💰 𝗦𝗮𝗹𝗮𝗿𝘆: $135k - $165k | 💼 𝗘𝘅𝗽𝗲𝗿𝗶𝗲𝗻𝗰𝗲: 4+ YOE | 🚀 𝗦𝘁𝗮𝗴𝗲: Series C | 🏛️ 𝗜𝗻𝘃𝗲𝘀𝘁𝗼𝗿𝘀: a16z
EarnIn: Strategy & Ops Manager | 🏠︎ 𝗟𝗼𝗰𝗮𝘁𝗶𝗼𝗻: Mountain View, CA | 💰 𝗦𝗮𝗹𝗮𝗿𝘆: $146k - $179k | 💼 𝗘𝘅𝗽𝗲𝗿𝗶𝗲𝗻𝗰𝗲: 6+ YOE | 🚀 𝗦𝘁𝗮𝗴𝗲: Series C | 🏛️ 𝗜𝗻𝘃𝗲𝘀𝘁𝗼𝗿𝘀: a16z, Ribbit Capital
OpenAI: Product Operations Manager, ChatGPT | 🏠︎ 𝗟𝗼𝗰𝗮𝘁𝗶𝗼𝗻: SF | 💰 𝗦𝗮𝗹𝗮𝗿𝘆: $180k - $240k | 💼 𝗘𝘅𝗽𝗲𝗿𝗶𝗲𝗻𝗰𝗲: Flexible | 🚀 𝗦𝘁𝗮𝗴𝗲: Series D+ | 🏛️ 𝗜𝗻𝘃𝗲𝘀𝘁𝗼𝗿𝘀: Thrive Capital, Khosla Ventures
Anthropic: Strategy Business Partner, Applied AI | 🏠︎ 𝗟𝗼𝗰𝗮𝘁𝗶𝗼𝗻: SF / NY | 💰 𝗦𝗮𝗹𝗮𝗿𝘆: $190k - $270k | 💼 𝗘𝘅𝗽𝗲𝗿𝗶𝗲𝗻𝗰𝗲: 5+ YOE | 🚀 𝗦𝘁𝗮𝗴𝗲: Series D+ | 🏛️ 𝗜𝗻𝘃𝗲𝘀𝘁𝗼𝗿𝘀: Lightspeed, General Catalyst, Bessemer
Scale AI: Strategic Finance Manager, GenAI | 🏠︎ 𝗟𝗼𝗰𝗮𝘁𝗶𝗼𝗻: SF / NY | 💰 𝗦𝗮𝗹𝗮𝗿𝘆: $112k - $140k | 💼 𝗘𝘅𝗽𝗲𝗿𝗶𝗲𝗻𝗰𝗲: 1+ YOE | 🚀 𝗦𝘁𝗮𝗴𝗲: Series D+ | 🏛️ 𝗜𝗻𝘃𝗲𝘀𝘁𝗼𝗿𝘀: Founders Fund, Index Ventures
Lyra Health: Sr. Associate, Growth Strategy, Provider Ops | 🏠︎ 𝗟𝗼𝗰𝗮𝘁𝗶𝗼𝗻: Remote | 💰 𝗦𝗮𝗹𝗮𝗿𝘆: $95k - $146k | 💼 𝗘𝘅𝗽𝗲𝗿𝗶𝗲𝗻𝗰𝗲: 4+ YOE | 🚀 𝗦𝘁𝗮𝗴𝗲: Series D+ | 🏛️ 𝗜𝗻𝘃𝗲𝘀𝘁𝗼𝗿𝘀: Coatue, Greylock, IVP
Airbnb: Senior Program & Business Operations Lead | 🏠︎ 𝗟𝗼𝗰𝗮𝘁𝗶𝗼𝗻: Remote | 💰 𝗦𝗮𝗹𝗮𝗿𝘆: $200k - $247k | 💼 𝗘𝘅𝗽𝗲𝗿𝗶𝗲𝗻𝗰𝗲: 12+ YOE | 🚀 𝗦𝘁𝗮𝗴𝗲: Public
📚 What I enjoyed reading recently
- : An epic essay on what constitutes a data moat (and what doesn’t)
There Are No New Ideas in AI… Only New Datasets by
: A deeper look at what has actually been driving progress in AI- : MCP continues to be a hot topic in AI, and this post provides a good overview of what it is and why it matters
[Paid] Tech hiring: is this an inflection point? by
: Solid overview of the recent developments in hiring (e.g. fully-remote loops becoming almost impossible due to use of AI)What should Allbirds have done differently? by
: A brutal (and fun) analysis of Allbirds’ rise and fallHow to turn chaos into clarity with Investigation Docs as an engineer by
and : A spiritual successor to my post on MECE structure on Jordans’ newsletter. If you’ve ever been in a metrics war room, you should read this.
ARR isn’t really a completely standardized metric, but that’s a discussion for another time
Note: For simplicity’s sake, we’re ignoring some other costs here that you could consider “variable”, e.g. marketing / user acquisition cost per order
For OTT orders, the food won’t be made if we can’t find a courier since they would have ordered it in-person. Technically, we could also factor in indirect costs such as decreased user engagement or churn as a result of these bad experiences, but we’ll ignore those second-order effects to keep things manageable